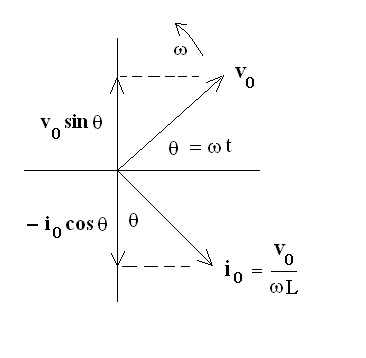
Figure 1. Conventional phasor diagram for an inductor. The phase angle with which the current ``lags behind'' the voltage is 90 degrees .
Randall D. Peters
Physics Department, Mercer University
Macon, Georgia
Copyright April 2010
Convention
Shown in Fig. 1 is a phasor diagram routinely used to describe an inductor. The sinusoidal potential across the coil windings, responsible for the current flow through the coils, is seen to ``lead'' the current by p/2 (90 degrees).

Figure 1. Conventional phasor diagram for an inductor. The
phase angle with which the current ``lags behind'' the voltage is 90 degrees .
In this representation, the fixed vectors (of magnitude v0 and i0) rotate about the origin with angular frequency w. The p/2 angle between them is maintained, and their projections onto the y-axis provide the time-dependent values of voltage and current at any instant, such as the time corresponding to angle q in the figure. The voltage is seen to be sinusoidal and the current co-sinusoidal, in keeping with their phase difference of p/2.
Faraday's Law
Faraday's law says that the voltage ``drop'' (``electromotive force'') across the inductor is at any time equal to the time rate of change of the magnetic flux acting through the inductor. Specified in terms of the inductance L, this takes the form
| (1) |
Assume that the voltage applied to the inductor is given by v(t) = v0 sin wt. Then Eq. (1) is readily integrated to yield the current which results from the application of this voltage.
| (2) |
It is seen from Eq. (2) that for this case the current never reverses direction. Clearly, Fig. 1 is not an appropriate phasor representation for the current specified by Eq. (2).
One might instead want to assume v(t) = v0 cos wt, so that the current is given by i(t) = [v0 /(wL)] sin wt. Then the phasor diagram of Fig. 1 is appropriate, except in terms of projections onto the x-axis instead of the y-axis.
The 2nd case requires that a switch be thrown to turn on the harmonic drive at just the right instant of time, corresponding to the cosine drive case. For other turn-on times, corresponding to variable phase values f between 0 and p/2, the steady d.c. component of the current is variable (for this zero-resistance case). The D.C. level, which lies in the range from 0 to one-half the peak-to-peak amplitude of the current, is given by (v0/wL)(1-sin f).
Influence of resistance
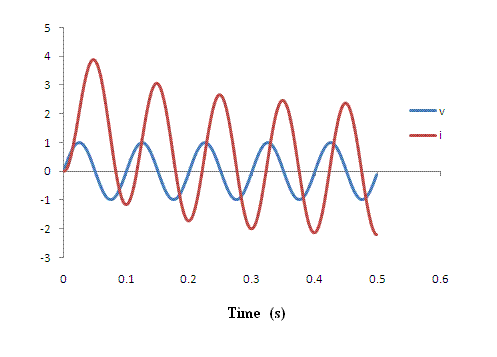
Whether a part of the inductor itself, or due to a resistor R placed in series with the inductor- it significantly alters the system. Fig. 2 shows the transient that results because of R, when driving with the (physically meaningful) v(t) = v0 sin wt.

Figure 2. Response of a 7 mH inductor
with R = 0.05 W, to a sinusoidal potential of 1 V zero-to-peak and
frequency 10 Hz. The curves were generated by simulating
the LR system using Excel and numerical integration by
means of the ``last point approximation''.
The transient is seen to have a life-time consistent with the time constant of L/R = 140 ms. Observe that the current ``relaxes'' to a steady state condition of direction-reversal with the same amount of current plus and minus.
Superconducting Solenoid
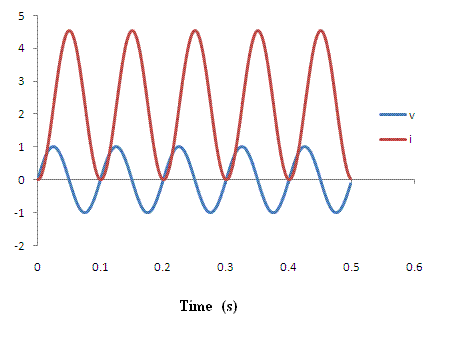
A superconducting solenoid case ( R = 0 ) is shown in Fig. 3.

Figure 3. An example of the voltage/current relationship corresponding
to a superconducting solenoid. The parameters are the same as in Fig. 2
except now R = 0.
For this case, the solenoid was already in the superconducting state when the voltage was turned on. It is possible to convert the Fig. 3 case to that of a Fig. 2 superconducting case by the following means. Establish the current in the normal (non-superconducting state, where R is not zero) with the temperature above the critical value, Then cool below the critical temperature where R becomes zero..